Welcome: ColorSpace 400-886-3881 400-886-3381
Language:
 ∷
∷

∷
∷


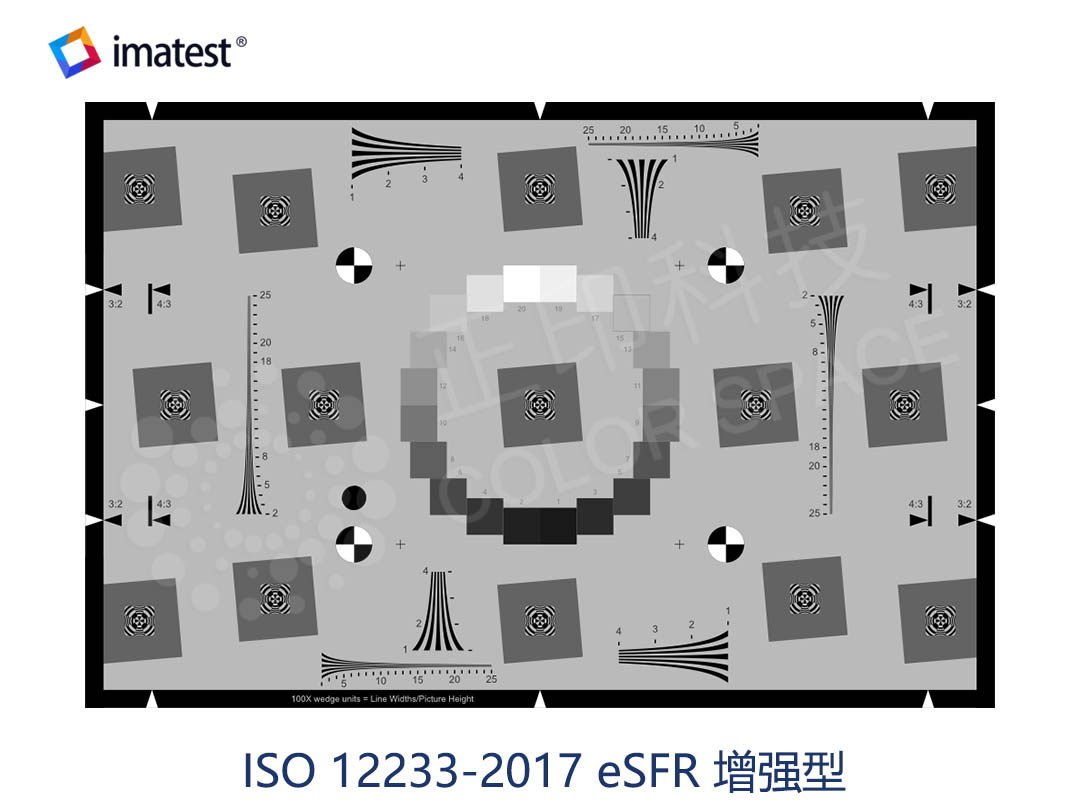
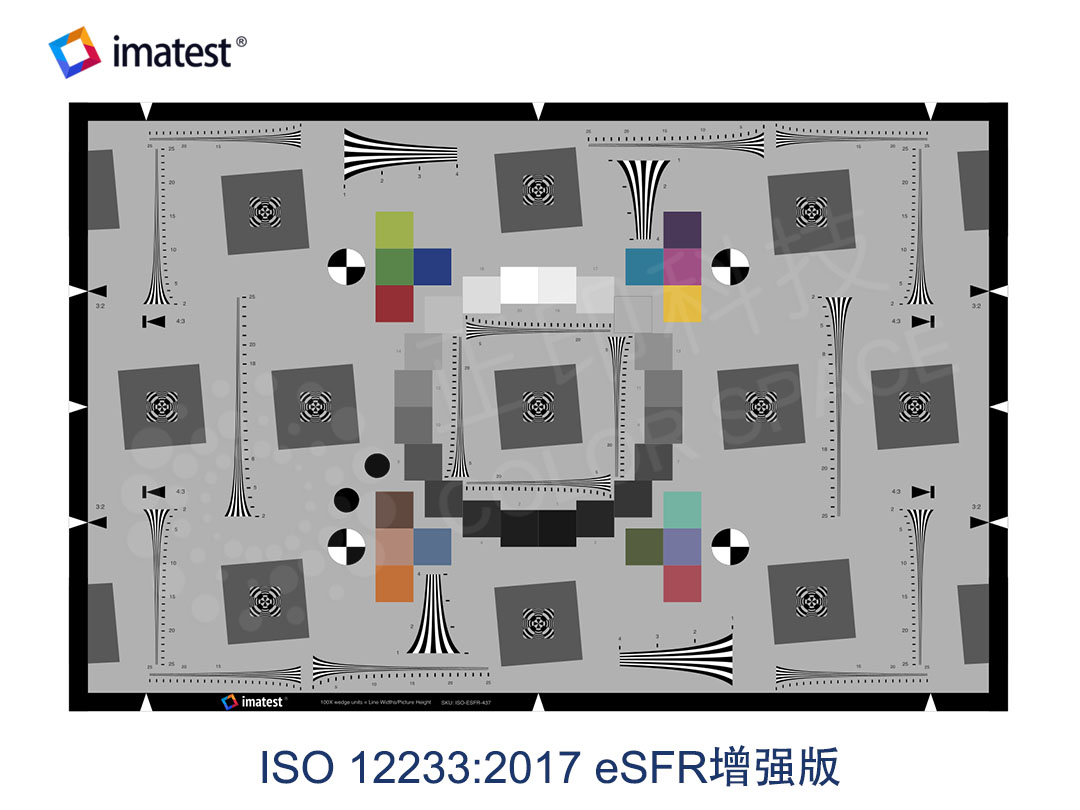
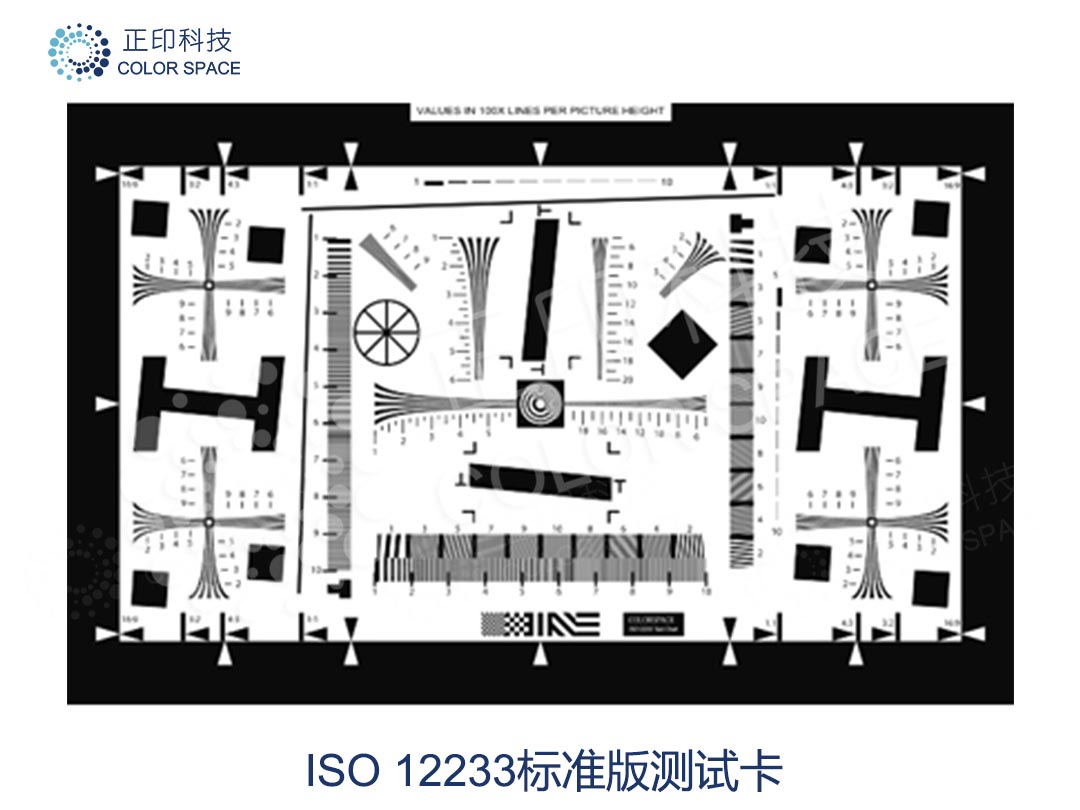
imatest ISO 12233:2017 E-SFR charts are implementations of the Low Contrast Edge SFR (eSFR) test chart illustrated in Section 6.1 and Annex C of the ISO Standard Document.We offer the Enhanced version of this chart in high resolution photographic prints, suitable for high resolution sensors up to 54MP at the 4x size.
The Imatest Enhanced ISO E-SFR chart has all the features of the Standard chart, keeping the 3:2 aspect ratio, with the addition of six added slanted squares for measuring performance near the image boundaries and hyperbolic wedges for visual analysis or analysis with the Imatest Wedge module. The differences between the Imatest charts and the chart illustrated in the standard are listed below. Even with these differences the Imatest chart is in full compliance with the standard.
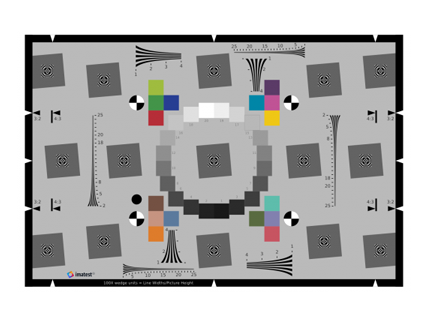
1. A 20-patch OECF grayscale pattern* is used as opposed to the 16-patch version.
2. The Focus Patterns in the centers of the squares are rectangular (to increase the MTF measurement area) and are designed to reduce interference with automatic edge detection.
3. There are four registration marks instead of three to facilitate automated region detection. (Four features are required for a projective transform.)
4. An additional mark above the lower-left registration mark is used for detecting chart orientation.
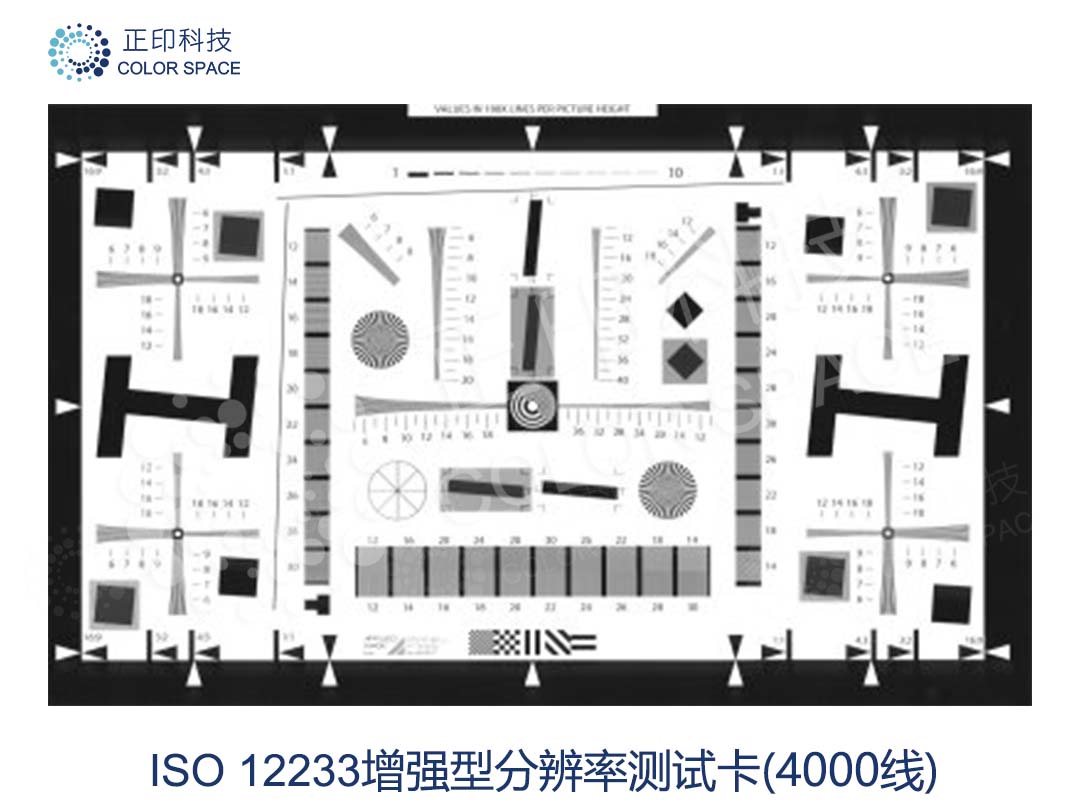
The differences between the Enhanced and Standard Versions are as follows:
1. Six extra slanted squares are added for measuring performance near the image boundaries.
2. Several hyperbolic wedges with spatial frequencies, similar to the CIPA chart referenced in the ISO standard, for visual analysis or use with the Imatest Wedge module.
3. 16 color patches when produced with technologies that allow color (inkjet or color LVT), with colors similar to the industry-standard 24-color test chart.
eSFR ISO can be run either through the highly-interactive Rescharts interface or as a batch-capable fixed module. The key documentation for getting started is Using eSFR ISO Part 1, found in the eSFR ISO section of the Documentation page. Badly-framed charts can be analyzed with SFR using manual ROI selection.

Product Parameter:
| Parameter | ISO 12233:2017 Edge SFR (eSFR) Photographic chart | |||
| Model | ISO-ESFR-184/185 | |||
| Size | ISO Size | Black and White | Color | Megapixel Suitability* |
| 1X |
200mm × 305mm
(7.875″ × 12″)
|
200mm × 305mm
(7.875″ × 12″)
|
3.4mp | |
| 2X |
400mm × 610mm
(15.75″ × 24″)
|
400mm × 610mm
(15.75″ × 24″)
|
13mp | |
| 4X |
800mm × 1220mm
(31.5″ × 48″)
|
800mm × 1220mm
(31.5″ × 48″)
|
54mp | |
| Type | Reflective / Transmissive | |||
| Spectrum | Visible | |||
| Relevant standards | ISO 12233:2017 | |||
Megapixel Quality Ratings*
Megapixel suitability is based on analysis of Modulation Transfer Function (MTF) obtained from a chart image captured using a 1:1 magnification lens (Canon 65mm f/2.8 1-5x macro) and a 6.5µm pixel size sensor (Canon EOS 6D). In order to consider performance throughout the cameras range of expected sharpness, MTF90 (the spatial frequency where MTF is 90%) is weighted at 0.5, MTF70 is weighted at 0.35, and MTF50 is weighted at 0.15. Conversion to megapixels is based on the Imatest Chart Quality Index (CQI) calculation which determines sensor height suitability using the equation 2 * MTFxx (cycles per object mm) * vertical chart height (mm), where xx is 90, 70 or 50. Megapixel suitability calculations assume that (1) the lens is of high quality, (2) that the chart fills the vertical field of view (vFoV) of the camera system, and (3) that the sensor aspect ratio is 3:2. For 16:9 aspect ratio sensors (with pillarboxed framing, if applicable), multiply the megapixel suitability by 1.185. For 4:3 aspect ratio sensors (with left/right sides of chart cropped), multiply megapixel suitability by 0.889. Charts can be suitable for significantly higher megapixel counts if the minimum resolvable feature size of the lens is larger than the pixel size or the chart fills less than the full sensor vertical field of view.
For more information, please contact: sales@colorspace.com.cn

Follow [ColorSpace] for industry news/events/solutions
Contact: sales@colorspace.com.cn
Phone: 15817270587
Tel: 400-886-3881(周一至周五 9:00~18:00)
Email: sales@colorspace.com.cn
Add: South Building #2-1101, Lv Di Qi Hang Office Building, Hou Sha Yu, Shun Yi District, Beijing, China