Welcome: ColorSpace 400-886-3881 400-886-3381
Language:
 ∷
∷

∷
∷


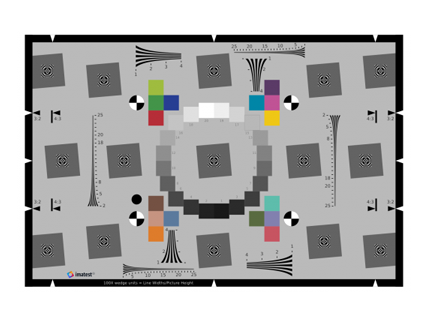
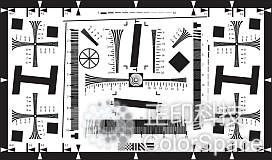
The ISO12233:2014 standard defines three test charts. The new Imatest eSFR ISO module performs a highly automated analysis of the new low-contrast (4:1) Edge SFR image and is provided in Imatest Master and Image Sensor 4.0.
|
|
|
|
|
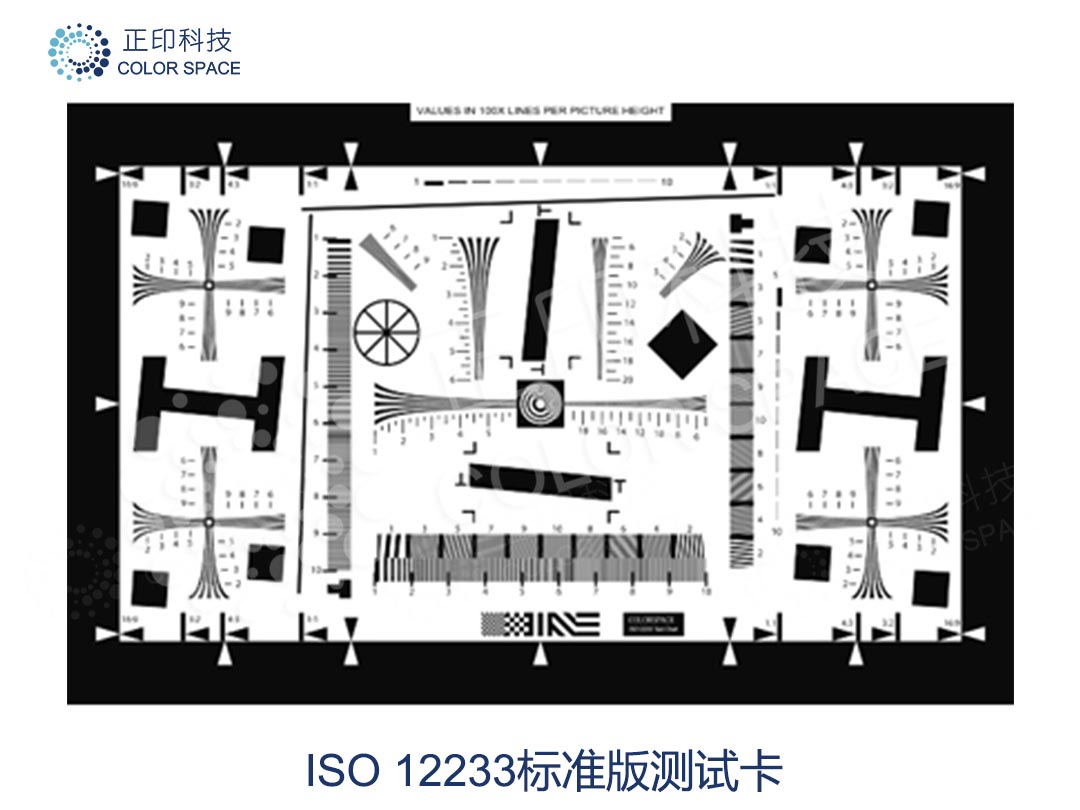
ISO 12233: 2014 test chart
|
||
|
CIPA resolution (wedge) test chart |
Hyperbolic wedge: 4 vertical directions, 4 horizontal directions and 2 diagonal (45 degrees) directions.
|
|
|
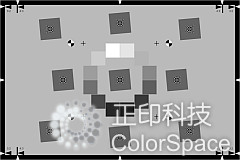
Low contrast bevel edge SFR (E-SFR) test card |
Contains 9 oblique squares for oblique edge measurement.
|
|
|
SFR test chart based on sine change |
Siemens Star Chart |
|
|
Old ISO-12233 chart |
2000 version
|
|
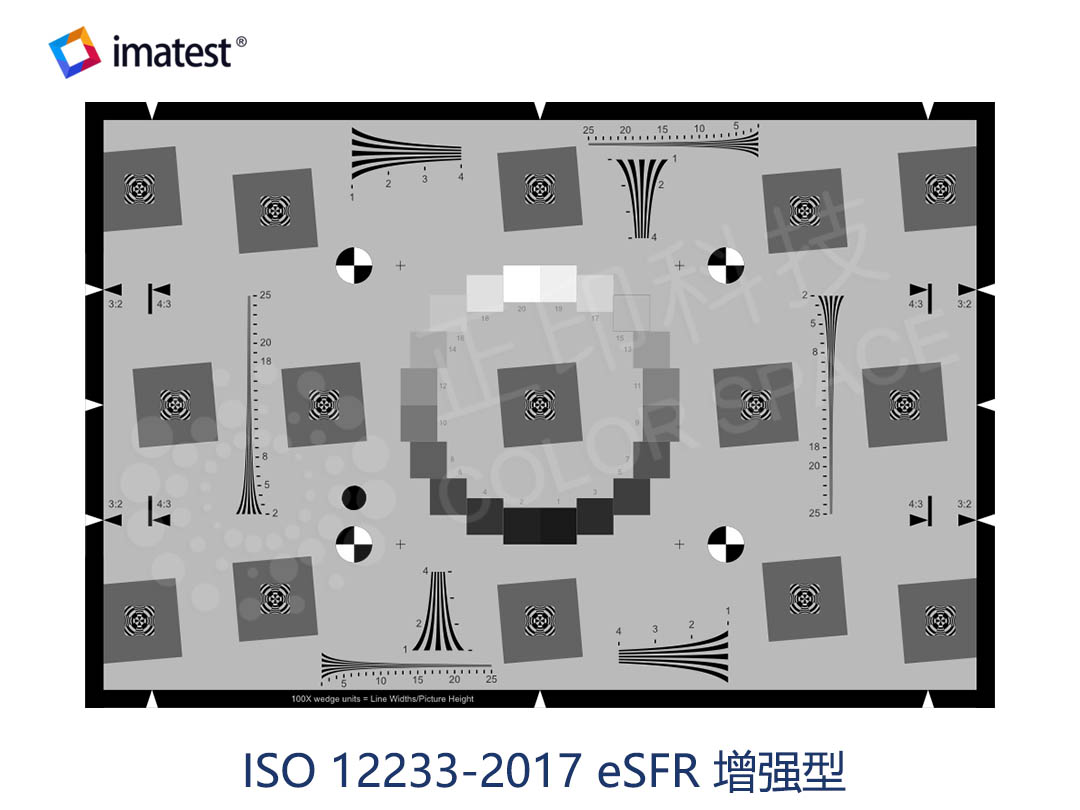
There are three types of Imatest eSFR ISO test charts: standard, enhanced and extended. All of these are in line with the standards of the chart shown in the ISO 12233:2014 document.

Standard eSFR ISO chart: 3:2 aspect ratio, no additional functions

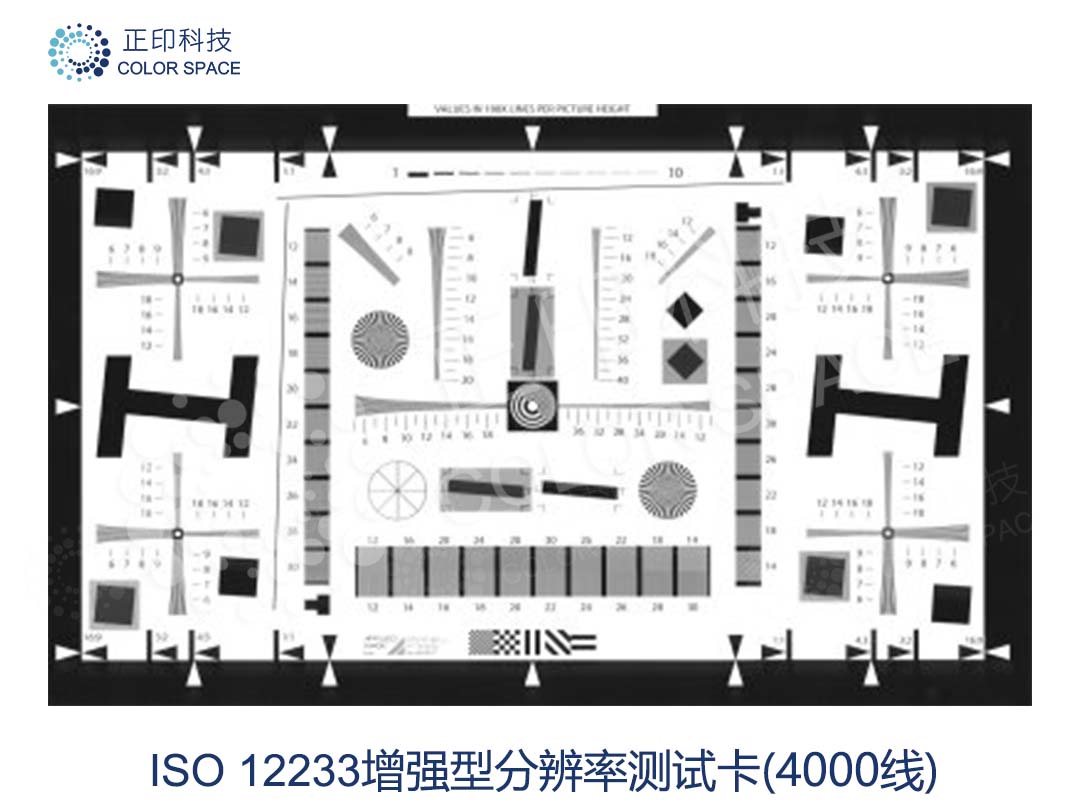
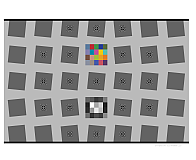
Enhanced eSFR ISO test chart: 3:2 aspect ratio, 6 sides plus square,
16 add color blocks, a few add wedge patterns.

Extended eSFR ISO test chart: 16:9 aspect ratio for HD TV and movies (for SLR cameras),
Six squares, 16 additional color blocks, and several additional wedge patterns have been added to the side.
The sharpness comes from the edge of the slanted rectangular boundary. eSFR ISO can handle various camera aspect ratios; when shooting a chart, the viewfinder can extend beyond the left and right sides of the test card or be inside it.
ImatestImatest's standard ESFR test card is very close to the test card shown in the ISO 12233:2014 standard document. On this basis, there are some subtle differences.
1. There are four registered (trusted) marks instead of three. Another black circle above the registration mark in the lower left corner is used to detect the orientation. This change is because the projection transformation used for automatic area detection requires four points. "Asymmetric features of automatic target detection", these features should be placed in the effective area of 4:3 aspect ratio range, but can be conveniently placed according to the use case. "
2. The focus assist patterns in the center of the square are different from the patterns shown in the ISO standard documents (not described in the standard): they are square (this allows more space for the oblique edge area for measuring sharpness), and they Designed to minimize interference with automatic area detection. They have no influence on the measurement results.
3. Use 20 patch OECF grayscale patterns. Said: "The test chart also includes the gray-scale patch used to determine the OECF, while the example chart in Figure C1 uses 16 OECF test gray-scales; it can also replace the 20 gray-scales described in ISO 14524. The enhanced and expanded chart will be Features added to the chart in areas not specified by the ISO standard (but not violated), which are valuable to most users.
Video introduction: eSFR ISO test card structure
|
|
|
eSFR ISO chart type |
||
|
Chart type |
Feature |
Detail |
|
Standard |
The closest to the chart in the standard file. No added features. |
The sharpness cannot be measured at or near the edges of the image. Use only when needed. It is recommended to use enhanced or extended charts for most purposes. |
|
Enhanced |
3:2 aspect ratio. Add 6 squares on the side; add a few hyperbolic wedges; add 16 color blocks to the inkjet and 8x10 inch LVT charts produced by Imatest. |
Most suitable for 4:3 or 3:2 aspect ratio (camera phones, compact cameras, digital SLR cameras) |
|
Extended |
16:9 aspect ratio. Same function as enhanced image. |
Suitable for 3:2 or 16:9 aspect ratio (DSLR, HDTV and cinema formats) |
|
eSFR ISO chart printing options |
||
|
|
Options |
Detail |
|
Chart aspect ratio |
3:2 (standard and enhanced) or 16:9 (extended) |
The 3:2 chart (standard and enhanced) is very suitable for SLR cameras (3:2 aspect ratio) and small digital cameras and camera phones (4:3 aspect ratio). The 16:9 (extended) chart is very suitable for HDTV (16:9 aspect ratio) and SLR cameras (3:2 aspect ratio). |
|
Contrast |
Only 4:1 |
The 4:1 contrast ratio is specified in the new ISO 12233:2014 standard. |
|
Grayscale step chart |
Include (below the center) |
Contains a 20-patch ISO 14524 circular grayscale pattern. |
|
Color chart |
16 patches |
Included in all inkjet printing enhanced and extended inkjet charts (all sizes) and LVT film (up to 8x10 inches) produced by Imatest. (Not available for reflective photos, not available yet.) |
|
Predistortion |
Undistorted (standard), two standard levels of predistortion, custom predistortion |
Pincushion pre-distortion can be used for fisheye (strong barrel distortion) lenses. Only suitable for matt surfaces. Please refer to the pre-distortion SFRplus test card for fisheye lenses. |
|
Extra wedges |
Standard (4 wedge pairs), |
There are 4 pairs of low-frequency and high-frequency wedges in the standard enhanced and expanded images. The version with additional wedges has at least 12 additional high-frequency wedges: 4 near the center and 8 near the corners. |
|
Media (surface) |
Matte inkjet |
Semigloss inkjet printers are slightly sharper and more accurate than grayscale inkjet printing in dark tones (printing density> 1.5), but are more susceptible to glare (specular reflection), especially wide-angle lenses. A matte surface is recommended for wide-angle lenses.
|
The new Imatest eSFR ISO module uses the new version of ISO 12233: 2014 E-SFR (Edge SFR) test chart. Image quality factors include:
· Sharpness: Expressed as spatial frequency response (SFR), also known as modulation transfer function (MTF).
Noise: Measured from the gray scale near the center of the chart, including all types of noise calculated by Multicharts and Multitest (standard pixel noise, chrominance noise, scene reference noise, sensor (raw) noise and ISO-15739 visual noise). SNR (signal to noise ratio) can also be expressed in dB or dB.
· Lateral chromatic aberration
· Distortion (has less detail than the distortion module). SFRplus distortion and field of view measurement details.
· Tonal response (less details compared with Stepchart, no noise statistics).
· When used with an eSFR ISO chart with optional color patterns, the color accuracy is located above the center of the test card.
· When inputting incident light, ISO sensitivity (based on saturation and standard output sensitivity).
· The starting point of aliasing and moiré measured from the four pairs of wedges in the enhancement and expansion chart has the same spatial frequency range as the separate ISO 12233:2014 wedge chart. The numbers and results are the same as the Wedge module.
All chart functions-slanted edges, gray patches, color blocks and wedges will be positioned automatically.
eSFR ISO has two modes:
· Interactive/setup mode (by pressing Rescharts or eSFR ISO settings in the main window of Imatest to run), allows you to select settings and interactively check the results in detail.
· Automatic mode (press eSFR ISO Auto to run in the main window of Imatest), which can run automatically without other user input. The ROI will be set automatically according to the settings saved in the interactive/setting mode. In this way, images of different sizes and frames can be analyzed without changing the settings. The automatic mode is suitable for large batches of files and is especially useful for automatic testing, where the frame may vary from image to image.
Note: The old ISO 12233:2000 standard and chart shown on the right are referenced in the new ISO 122433:2014 standard, but it is no longer an official part of the standard. The new standard specifies three graphs, one of which is a slope (Edge SFR or E-SFR) graph with a much lower contrast ratio (4:1; as shown in the figure on the right).
Compared with the old ISO 12233 chart:
· The new eSFR ISO chart is much less wasteful, especially in the enhanced and extended versions. Approximately 90% of the old ISO test card area is of no value to computer analysis.
· You can use enhanced and expanded charts to generate detailed results of sharpness (MTF) on the image surface. The old ISO chart cannot be realized because there are not enough edges and their position distribution is not very good.
ISO 12233: 2014 Edge SFR chart
· Automatic area detection, based on the location conditions you enter. This makes the eSFR ISO charts and modules very suitable for automated testing: with the old ISO charts, as long as the image frame changes, even if it changes slightly, the region of interest (ROI) must be carefully selected.
· 4:1 contrast edges are less likely to be cut than the edges in the old ISO chart, and the contrast ratio is specified at ≥40:1. The camera works in a more linear area, so the results are more consistent and accurate-not affected by overexposure, underexposure, incorrect gamma estimation or excessive software sharpening. The 4:1 contrast edge is also more representative of the real edge that affects the perceived image sharpness.
· eSFR ISO can measure additional image quality factors, including lateral chromatic aberration, distortion, gamma (contrast), tone response, and color accuracy (in a chart with color patterns).
· The old ISO 12233:2000 chart does not contain information that can be used to measure gamma (the average slope of the Log object vs. the log exposure curve, that is, the contrast), which is required for the image linearization calculated by the MTF. Accurate gamma measurement is particularly important for high-contrast targets. In the eSFR ISO chart, the gamma can be derived from individual squares (which have a known 4:1 contrast) or gray-level chart.
Compared with the SFRplus diagram:
· The mapping of MTF on the image surface has less details.
· Since there is no distortion bar and there are fewer distortion measurement functions, the accuracy of distortion measurement is slightly worse (especially for standard graphs).
· You can use detailed noise analysis (including all types of noise measured in Multicharts and Multitest).
· Wedge analysis (including initial aliasing and moiré) can be used. The standard chart has 4 pairs of added wedges. A version of the chart has at least 12 additional wedges (4 near the center and 8 near the corners).
Contact: sales@colorspace.com.cn
Phone: 15817270587
Tel: 400-886-3881(周一至周五 9:00~18:00)
Email: sales@colorspace.com.cn
Add: South Building #2-1101, Lv Di Qi Hang Office Building, Hou Sha Yu, Shun Yi District, Beijing, China